🎧 Listen to the Podcast Version
Prefer listening over reading? This is a podcast-style discussion generated from the article — not a text-to-speech narration.
⏱ ~ 22 min listen • Best for multitasking
TL;DR:
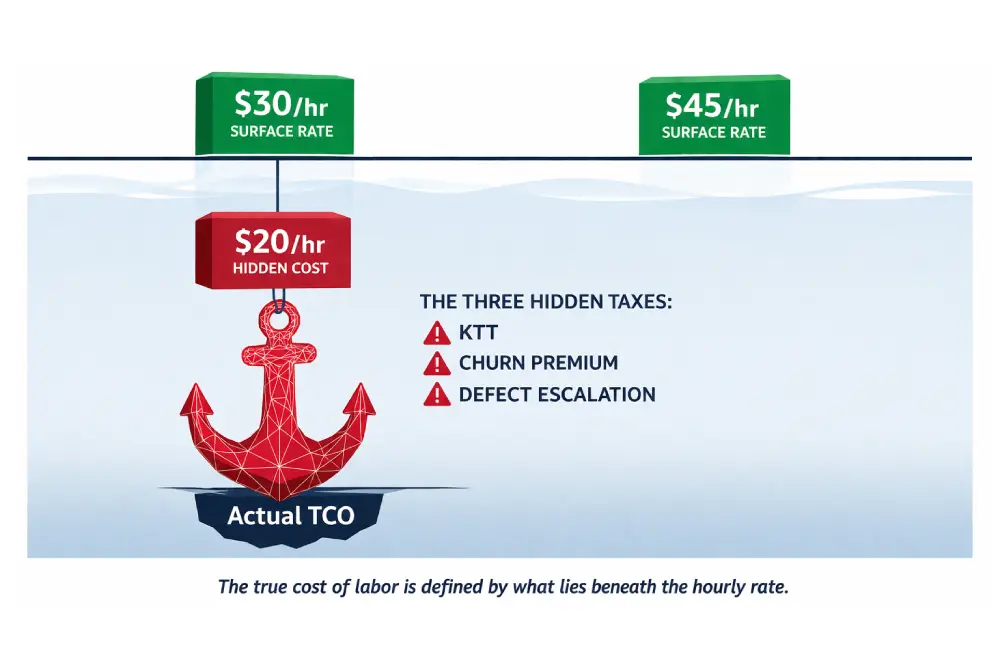
A “cheap” offshore team at $30/hour with 40% annual turnover actually costs $43/hour. You pay three hidden taxes:
- Knowledge Transfer Tax (constant retraining)
- Recruitment Amortization (short tenure kills ROI)
- Defect Remediation (inexperienced developers ship bugs).
A premium partner at $45/hour with 10% turnover costs $46/hour effectively. The $3/hour difference buys stability, IP protection, and roadmap predictability. High-retention teams function as appreciating capital assets. High-churn teams destroy shareholder value.
The Hourly Rate Trap
Software engineering is no longer a support function. It’s the primary engine of value creation. Yet procurement treats it as a fungible commodity.
The typical calculation seems irrefutable:
- Onshore developer: $150/hour
- Offshore vendor: $35/hour
- Apparent savings: 76%
This rests on a fatal assumption. It assumes one hour of engineering output equals one standard unit of value across all individuals and timelines.
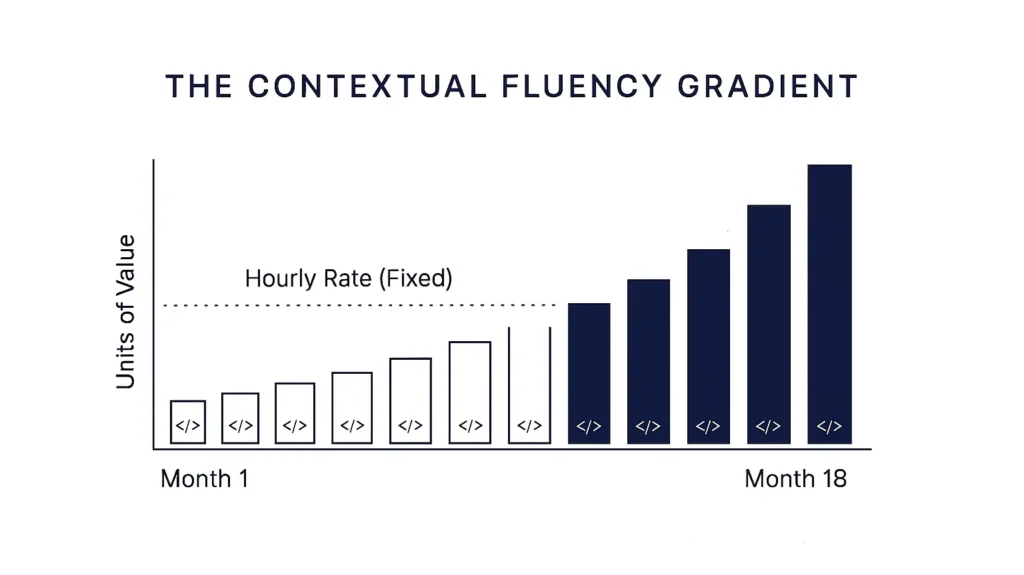
This assumption is wrong. Productive output depends on “Contextual Fluency”: understanding your business domain, knowing your legacy codebase quirks, and holding institutional tribal knowledge.
Context isn’t present at the engagement start. It’s acquired over time. The hourly rate is a vanity metric. The only metric that impacts P&L is Total Cost of Ownership (TCO) per unit of delivered functionality.
The Three Hidden Taxes of Attrition
Realized cost inflates through three compounding taxes:
1. The Knowledge Transfer Tax (KTT): Perpetual Productivity Drain
Every departure triggers a “Context Gap” requiring extensive knowledge transfer. This consumes billable hours while producing zero functionality.
The Velocity Void: New hires need 3-6 months to reach “Reasonable Productivity” and 12-18 months for “Full Proficiency.” During ramp-up, they bill at 100% but deliver roughly 50% productivity.
The Senior Drag: New engineers consume time from your most valuable assets (Senior Engineers, Architects, Tech Leads). If a Principal Engineer at $200/hour spends 15 hours/week for 2 months mentoring a replacement, that’s $24,000 in shadow costs per departure.
Financial Model: 24-Month Comparison
Scenario A: “Low Cost” Vendor
- 10 Engineers at $30/hour
- 40% annual attrition (8 departures over 24 months)
- 5-month ramp-up per replacement
Lost Productivity: 8 engineers × 5 months × 50% loss = 20 FTE months = $96,000
Senior Drag: 8 replacements × 40 hours × $150/hour = $48,000
Total Hidden KTT: $144,000
Scenario B: “High Performance” Partner
- 10 Engineers at $45/hour
- 10% annual attrition (2 departures over 24 months)
- 4-month ramp-up per replacement
Total Hidden KTT: $18,000
The premium team yields dramatically lower TCO despite 50% higher hourly rates.
2. Recruitment Amortization: The Churn Premium
Recruiting and onboarding an engineer costs $20,000-$40,000 (agency fees, interviewing time, background checks, hardware, training). Financial efficiency depends entirely on tenure.
3-Year Tenure: $25,000 acquisition cost ÷ 36 months = $694/month amortization
9-Month Tenure: $25,000 ÷ 9 months = $2,777/month amortization
This creates a “Churn Premium”—a hidden surcharge on every billable hour.
| Metric | Low-Cost Vendor | High-Retention Partner |
|---|---|---|
| Hourly Rate | $30.00 | $45.00 |
| Average Tenure | 12 Months | 38 Months |
| Total Acquisition Cost | $25,000 | $9,000 |
| Monthly Amortization | $2,083 | $236 |
| Effective Hourly Add-On | +$13.00 | +$1.47 |
| Real Hourly Cost | $43.00 | $46.47 |
When Churn Premium is factored in, the price gap collapses from $15/hour to $3/hour.
3. The Cost of Rework: Defect Escalation Economics
High-churn teams lack deep system knowledge to write clean code. They’re unfamiliar with side effects, legacy dependencies, and business logic constraints. They introduce high volumes of regressions—bugs that break existing functionality.
Stop Managing. Start Shipping.
Stop fixing “outsourced” spaghetti code.
Deploy an ISO 27001-certified engineering pod that hits your internal linting standards and security benchmarks from Day 1.
Defect Economics: The 1-10-100 Rule
The cost of correcting a defect increases by 10x for each lifecycle stage it escapes detection:
$1 (Prevention): Catching defects during Design phase. A tenured engineer reviews specifications and identifies logical flaws before coding begins.
$10 (Correction): Catching defects during Testing phase. A Unit Test or QA engineer discovers the bug before production.
$100 (Failure): Defects found in Production. Includes remediation cost, customer support, SLA penalties, reputational damage, and executive time.
| Lifecycle Stage | Cost Factor | Impact of High Attrition |
|---|---|---|
| Design / Requirements | 1x ($100) | High: Attrition removes experienced engineers who spot logical flaws early |
| Coding / Unit Testing | 10x ($1,000) | Medium: Turnover creates “flaky” test suites and rushed reviews |
| Integration Testing | 50x ($5,000) | High: New QA staff miss edge cases due to lack of system knowledge |
| Production | 100x ($10,000+) | Critical: High churn ensures defects reach this expensive stage |
A team with high attrition systematically loses “Level 1” defense. New hires lack contextual fluency to spot design flaws. They implement what tickets say, even when it contradicts system logic.
If a stable team catches 90% of bugs at Level 1-10 (spending $100-$1,000 per bug), and a high-churn team allows 50% to escape to Level 100 (spending $10,000+ per bug), the Cost of Quality for the churned team is exponentially higher.
According to research by Gartner, downtime costs exceed $300,000 per hour. A single escaped defect from lack of context can eliminate an entire year’s “savings” from cheap hourly rates.
Engineering as Appreciating Capital Asset
An engineer’s value follows a distinct productivity lifecycle:
Investment Zone (Months 0-6): Net financial drain. They consume salary, hardware, and senior team member time while producing minimal output.
Break-Even Point (Months 6-9): Output roughly equals fully-loaded cost plus management overhead.
Dividend Zone (Months 9-24): Full autonomy. They produce significantly more value than they cost, generating positive ROI.
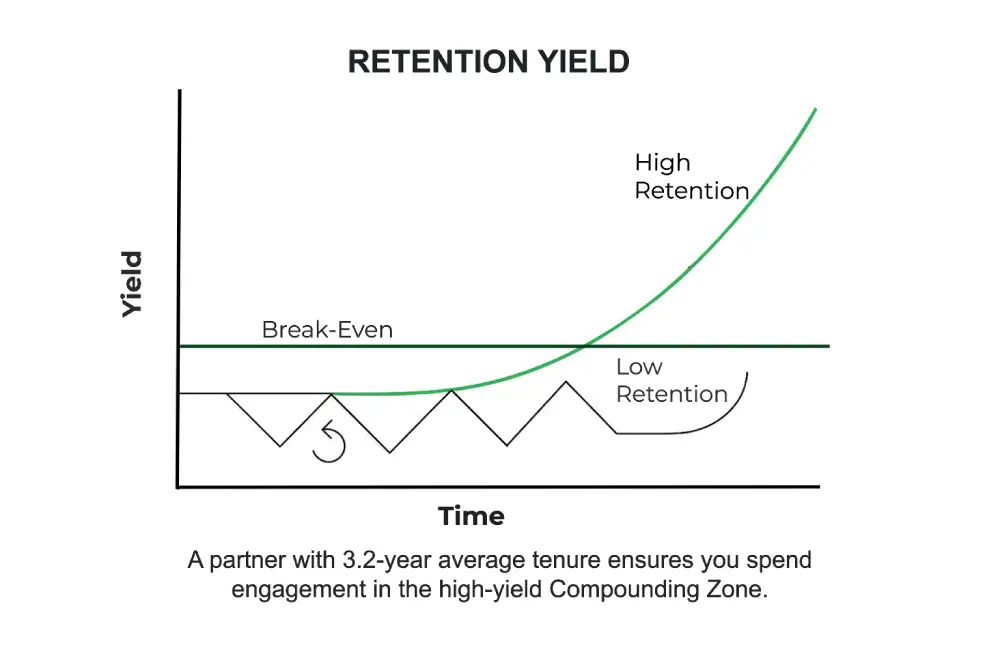
Compounding Zone (Year 2+): Force multiplier. They improve architecture, mentor juniors, prevent disasters, and accumulate “Domain Expertise Equity.”
If average tenure is 12 months, you remain perpetually trapped in the Investment Zone. Just as the engineer reaches the Dividend Zone, they exit. You paid for training and donated productivity to the labor market.
Retention is the only mechanism that captures Dividend and Compounding Zones. A partner with 3.2-year average tenure ensures you spend most engagement in the high-yield Compounding Zone.
Exit-Oriented Development: The Principal-Agent Problem
Transient engineers who expect to leave within 8-12 months operate under different incentives. They maximize short-term observable output (tickets closed, features shipped) at the expense of long-term system stability.
Common patterns:
- Hard-coding vs. configuration: Hard-coding is faster but creates rigidity they won’t deal with
- Ignoring edge cases: Focus on “happy path” functionality; edge cases become production incidents after departure
- Documentation debt: No incentive to invest in future team productivity
- Superficial patches: Quick fixes instead of proper refactoring accumulate as technical debt
This creates “Information Asymmetry.” The Project Dashboard shows “Green” (Features Shipped On Time), while actual Codebase Quality deteriorates to “Red” (Technical Debt Accumulating, Defect Density Increasing). CFOs make strategic commitments based on green dashboards, unaware of structural fragility beneath the surface.
Capitalization Risk and Compliance Exposure
Under FASB ASC 350-40, companies can capitalize development costs as balance sheet assets instead of immediate OpEx. This significantly improves near-term EBITDA.
High attrition threatens this. If critical projects experience delays because the lead architect resigned and no one understands the system, the “Probable-to-Complete” assertion may fail audit scrutiny. Accumulated capitalized costs become subject to Impairment—a sudden, concentrated expense hitting P&L in a single quarter.
For regulated industries (Healthcare/HIPAA, FinTech/SOC2), attrition creates direct compliance risk:
- Every departure requires immediate access revocation across all systems; high churn increases “zombie account” probability
- Perpetually “green” teams on security protocols increase accidental data exposure incidents
- Broken audit trails when departed engineers were responsible for critical changes
The Nepal Advantage: Stability Arbitrage
Traditional outsourcing hubs (Bangalore, Vietnam, Philippines) face 20-30% structural attrition driven by hyper-competition and wage spirals.
Nepal offers different economics:
- Average tenure: 3.2 years (38 months) — 2-3x industry average
- English as primary STEM instruction medium — eliminates language barrier costs
- Enterprise-grade infrastructure redundancy — dual-fiber ISPs, diesel generators, Starlink backup, work-from-anywhere protocols
Selecting Nepal isn’t about finding the “cheapest” developer. It’s about identifying the “longest-tenured” developer, which mathematically produces lowest TCO when you factor Knowledge Transfer Tax, Recruitment Amortization, and Defect Remediation costs.
Conclusion: Choose Capital Assets Over Transient Labor
A $30/hour vendor with 40% attrition effectively costs $43/hour while delivering lower quality, higher risk, and zero IP equity.
A $45/hour partner with 10% attrition costs $46/hour effectively while building compounding assets that accelerate roadmap velocity and protect intellectual property.
The $3/hour difference purchases stability, knowledge continuity, compliance integrity, and strategic optionality.
The CFO’s Risk Audit Checklist
- Audit Current Attrition: What is your external partner’s real annual turnover? If it exceeds 20%, you’re paying a hidden “Churn Premium” inflating TCO by 30-50%.
- Calculate Knowledge Transfer Tax: How many senior engineering hours are consumed by onboarding replacement contractors? Multiply by fully-loaded hourly cost to quantify opportunity cost.
- Evaluate Domain Expertise Equity: Is your team accumulating institutional knowledge that appreciates, or just executing tickets without building strategic capability?
- Assess Compliance Risk: Does vendor churn threaten your ISO 27001, HIPAA, or SOC2 audit posture through broken audit trails and perpetually inexperienced teams?
- Measure Capitalization Risk: Is high attrition introducing “Probable-to-Complete” uncertainty that threatens your ability to capitalize development costs and reduce EBITDA?
Immediate Action
Calculate the exact dollar value of attrition liability on your balance sheet. Input your vendor’s real attrition rate, recruitment costs, ramp-up times, and senior shadow costs into a comprehensive TCO model. Quantify the hidden expense. Present data to your Risk Committee.
The choice isn’t between “Onshore” and “Offshore.” It’s between “Transient Labor” (a consumable expense that depreciates immediately) and “Capital Assets” (an investment that appreciates through knowledge accumulation).
Choose the asset.
Stop Managing. Start Shipping.
Stop fixing “outsourced” spaghetti code.
Deploy an ISO 27001-certified engineering pod that hits your internal linting standards and security benchmarks from Day 1.