TL;DR
The “Watermelon Project” reports green on dashboards for months, then reveals a critical red interior days before launch. This isn’t caused by incompetence or malice. It’s caused by broken feedback loops and psychological safety failures.
This guide provides specific protocols to eliminate green-shifting:
- Enforce the 48-Hour Escalation Rule
- Monitor hard signals: Code Churn >30%, WIP >2, Commit-to-Deploy gaps >48h
- Replace trust-based reporting with telemetry-driven transparency
- Shift focus from managing people to managing flow
The solution uses objective metrics that cannot be gamed. For engineering leaders who refuse to accept “surprise” as a management strategy, this is the blueprint for production-ready engineering governance.
The Mathematical Reality of Engineering Failure
In modern enterprise software engineering, the “Watermelon Project” represents one of the most destructive patterns a technical leader will encounter.
Picture this: Your strategic initiative reports “green” across every status dashboard for three solid months. Stakeholders are confident. The roadmap looks secure. Then, two weeks before the scheduled delivery, the project breaks open to reveal a catastrophically red interior. The deadline is impossible. The recovery window has closed. What should have been a manageable risk has become a write-off.
This phenomenon is not the result of technical incompetence alone. It’s not typically driven by malicious actors deliberately deceiving leadership. Rather, it’s the mathematical outcome of three problems:
- Broken feedback loops
- Psychological safety failures
- Reliance on subjective reports, not objective data
The impact on leadership is severe. It burns capital on unrecoverable delays. It forces death march sprints that erode talent retention.
The “green-shift” ensures leadership is always the last to know the truth. This is the behavioral pattern where bad news gets suppressed or softened as it travels up the hierarchy. By the time the red signal reaches the decision-maker, the recovery window has often closed completely. What could have been a $1,000 problem becomes a $100,000 catastrophe.
This operational guide provides a strict solution. It rejects the “trust-based” management style that relies on what engineers say in stand-ups. Instead, it focuses on “mechanized transparency” that relies on what the code actually does in the repository.
Drawing on behavioral psychology (the Mum Effect), queueing theory (Little’s Law and Value Stream Mapping), and DevOps telemetry (DORA metrics), this document outlines a zero-trust governance framework. It’s designed for the skeptical technical leader who demands production-ready engineering pods.
Why Leadership Is Always the Last to Know
The core thesis is straightforward. In a physical system, blockages create pressure. In software delivery systems, blockages create silence. To dismantle the Watermelon Project, we must first understand the psychological and structural forces that create this silence.
The Green-Shift Progression
Green-shifting describes the behavioral pattern where project status is reported in positive terms despite mounting evidence of serious problems. This isn’t mere optimism. It’s a systematic distortion of reality that grows worse at every organizational level.
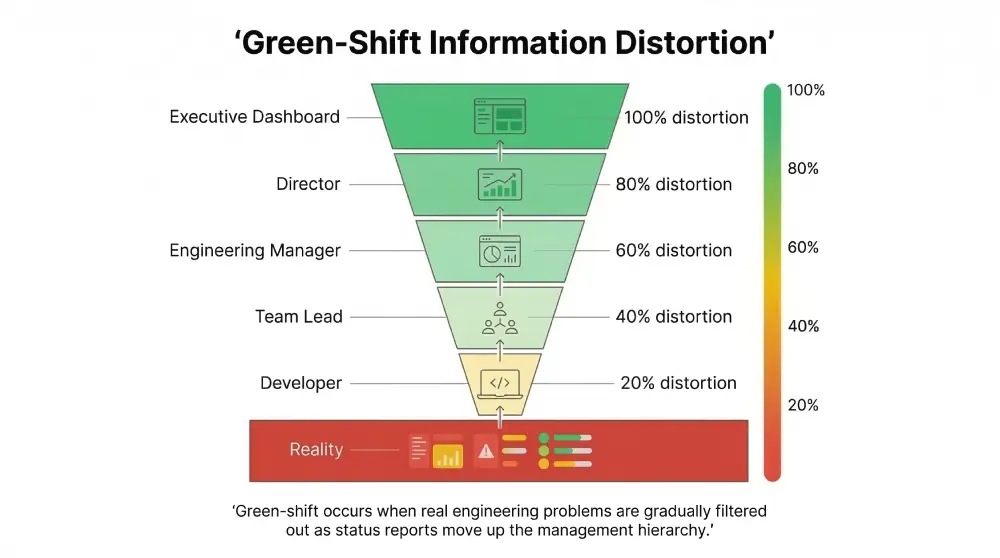
The mechanism involves multiple levels of filtering. An individual contributor encounters a technical blocker (perhaps a legacy code dependency or an ambiguous requirement). Rather than immediately flagging it as a “stop,” they classify it as a “challenge” they can overcome with more time. They report “green” to their Team Lead, assuming they’ll resolve it by tomorrow.
The Team Lead aggregates reports from five developers. They see one “challenge” and four “on-track” updates. To avoid appearing unable to manage their pod, they report “green” to the Engineering Manager. The Engineering Manager, focused on quarterly roadmap commitments, filters out the “noise” of minor challenges. They report “green” to the Director.
This filtering process creates what can only be described as a “Green Illusion.” The dashboard remains green while the actual delivery timeline quietly loses credibility. The status light only turns red when the deadline becomes mathematically impossible to meet. This usually happens weeks after the actual failure occurred.
| Hierarchical Level | Information State (Reality) | Reported Status | Motivation for Shift | Information Loss |
| Developer (IC) | “I’m stuck on this API integration, but I can probably hack a fix.” | Green (Optimistic) | Fear of appearing incompetent; belief in heroics | 20% |
| Team Lead | “One dev is struggling, but the rest are fine. We’ll absorb the delay.” | Green (Aggregated) | Fear of alarming management; desire to shield team | 40% |
| Engineering Manager | “Velocity is slightly down, but we have buffer in the sprint.” | Green (Filtered) | Focus on quarterly goals; fear of red KPIs | 60% |
| Director / VP | “All pods report green. Roadmap is secure.” | Green (Delusional) | Lack of raw telemetry; distance from code | 80% |
| The Outcome | Critical Delay | Red (Catastrophic) | The project is already dead; nobody knows it yet | 100% |
The green-shift is not a deception. It functions as a coping mechanism within a system that rewards “green” status reports rather than accurate ones. In many organizations, a “red” status triggers micromanagement, audits, and intense leadership scrutiny. Therefore, the rational actor avoids “red” at all costs until failure becomes undeniable.
This behavior effectively disables the organization’s immune system. It prevents the organization from reacting to infections (delays) until they become terminal.
The Mum Effect Creates Fatal Latency
The psychological engine driving green-shifting is what researchers call the “Mum Effect.” First identified in psychological research by Rosen and Tesser in the 1970s, the Mum Effect refers to the strong reluctance of individuals to transmit unpleasant messages.
Research indicates that this reluctance is not driven by concern for the recipient’s discomfort. Instead, it’s driven by the sender’s own self-image management. People want to avoid being associated with failure. This is the “shoot the messenger” bias.
In software engineering contexts, the Mum Effect introduces critical latency. When a fault occurs (a critical bug is found, an architectural assumption is proven wrong), there exists a time lag between the event and the reporting of the event. This lag represents the “Mum Latency.”

Research examining IT project reporting shows this effect is made worse by two factors:
- Fault Responsibility: If a developer feels personally responsible for the error (“I broke the build,” “I misunderstood the requirement”), they are significantly less likely to report it immediately. They will attempt to fix it secretly to avoid blame. When the fault lies with an external vendor or a tool failure, reporting rates increase because the “blame” is externalized.
- Time Urgency: As deadlines approach, the pressure to report bad news should theoretically increase. The impact of delays is higher. However, studies show that high time pressure often suppresses reporting further. The fear of disrupting the “sprint commitment” or ruining the “release party” forces silence until the very last moment.
Because of the Mum Effect, management hears about the problem only after the recovery window closes. This turns a $1,000 problem into a $100,000 catastrophe. Every technical problem has a window of time during which it can be solved with linear cost (refactoring a module). Once that window closes, the cost becomes exponential (rewriting the entire subsystem because other modules were built on top of the broken one).
Trust Versus Verification
The traditional “trust-based reporting” model asks: How do you feel about the sprint?
The “mechanized transparency” model asks: What is the cycle time of the last 10 tickets?
Subjective status updates are inherently gameable. A developer can say “I’m almost done” for three consecutive days. They often genuinely believe it to be true each time. Telemetry cannot be gamed. If a Pull Request has not been merged in 72 hours, the work is stuck. This is true regardless of what the developer reports in stand-up.
To kill the Watermelon Project, we must make a fundamental shift. We stop listening exclusively to people. We start listening to the system. We replace “status meetings” with “telemetry reviews.”
Trust is a social virtue. But in engineering management, it represents a vulnerability. Transparency, by contrast, is a form of respect. By creating systems that expose the reality of the work, we respect the team’s effort. We identify blockers they cannot solve alone. We move from a culture of “hiding” to a culture of “solving.”
Diagnostic Telemetry: The Hard Signals That Cannot Lie
To eliminate green-shifting, we must implement a system of “Hard Signals.” These are objective, machine-generated metrics that serve as an early warning system for project health. These metrics come directly from the Version Control System and Project Management tools. They bypass human interpretation entirely.
Code Churn Above 30 Percent: The Spinning Wheels Signal
Code Churn measures the percentage of a developer’s own code that is modified or deleted shortly after being written (typically within three weeks). While some churn is natural during refactoring or prototyping, sustained high churn indicates that the developer is “spinning their wheels.”
It suggests that for every 100 lines of code written, 30 are being discarded immediately.
There are three types of churn:
- Exploratory Churn (Acceptable): High churn at the project start as the team prototypes solutions. This should drop rapidly as the architecture solidifies.
- Refactoring Churn (Neutral): High churn during a designated “Technical Debt Sprint.” This is planned and healthy.
- Thrashing Churn (Critical): High churn in the middle of feature development. This is the danger signal that demands immediate intervention.
When Code Churn exceeds 30 percent, it typically indicates one of three scenarios:
Ambiguity: The developer does not understand the requirements. They write code, realize it’s wrong, delete it, and rewrite it. This is a failure of the Product Owner or the specification, not the developer.
Brittle Architecture: Every new feature requires breaking existing code. The developer is fighting the codebase rather than extending it cleanly.
Skill Gap: The developer is struggling with the language or framework. They’re attempting to brute-force a solution without a clear design.
Protocol: When Churn >30% is detected, stop pushing harder. High churn means negative velocity. Audit the specification (80% of high churn is caused by ambiguous requirements). Assign a Senior Architect to pair with the developer for 24 hours as a diagnostic tool.
WIP Saturation: The Gridlock Signal
Work In Progress (WIP) measures the count of active tickets assigned to a single developer that are not in a “Done” state. The critical threshold: WIP greater than 2 per developer.
If a developer has five tickets “In Progress,” they are blocked on four of them. This is not multitasking. It represents “context switching thrashing.”
The science behind context switching is clear. Research by Gerald Weinberg in Quality Software Management: Systems Thinking provides definitive statistics on the cost of context switching. Every time a developer switches tasks, a “context penalty” is paid. They must unload the current mental model (variables, logic, flow) and load the new one. The brain is not a parallel processor. It is a serial processor with a high “load time.”
| Number of Simultaneous Tasks | Percent of Time on Value Work | Percent Lost to Context Switching | Impact on Velocity |
| 1 | 100% | 0% | Maximum Flow |
| 2 | 80% | 20% | Manageable friction |
| 3 | 60% | 40% | Significant drag |
| 4 | 40% | 60% | Majority waste |
| 5 | 20% | 80% | Gridlock |
When a manager sees a developer with five active tickets, they often perceive “high activity.” The hard signal reveals “20 percent productivity.” The developer is spending 80 percent of their cognitive energy re-orienting themselves, not coding. They are effectively working one day a week while being paid for five.
The Protocol:
- Implement hard WIP limits. Configure Jira or Kanban boards to physically prevent dragging a ticket into “In Progress” if the limit (2) is reached. This forces the developer to clear existing work before starting new work.
- Enforce the “Stop-Starting” rule: “Stop Starting, Start Finishing.” No new work can be pulled until a current item is moved to QA or Done.
The Commit-to-Deploy Gap: Hoarded Risk Signal
This metric measures the elapsed time between the first commit on a branch and the deployment of that code to a shared environment (Staging or Production). The critical threshold: gaps exceeding 48 hours.
Code that lives on a developer’s laptop for more than two days represents “Inventory.” In Lean manufacturing terms, inventory is waste. It represents value that has been created but not realized. More dangerously, unmerged code acts as “Integration Debt.” The longer a branch diverges from the main trunk, the higher the probability of merge conflicts, logical regressions, and “integration hell.”
DORA metrics provide clear benchmarks. The “Elite” standard for Lead Time for Changes (Commit to Deploy) is less than one hour. High performers achieve it in under a day. A gap of 48 hours places a team in the “Medium” to “Low” performance cluster. It indicates a high risk of deployment failure.
The Protocol:
- Mandate the use of Feature Flags to allow incomplete code to be merged safely. This decouples “Deployment” (moving code) from “Release” (turning it on). It allows developers to merge their work daily without breaking the build.
- Enforce atomic commits. A ticket that takes five days must be broken into five one-day tasks. Large tickets encourage hoarding code. Small tickets encourage streaming code.
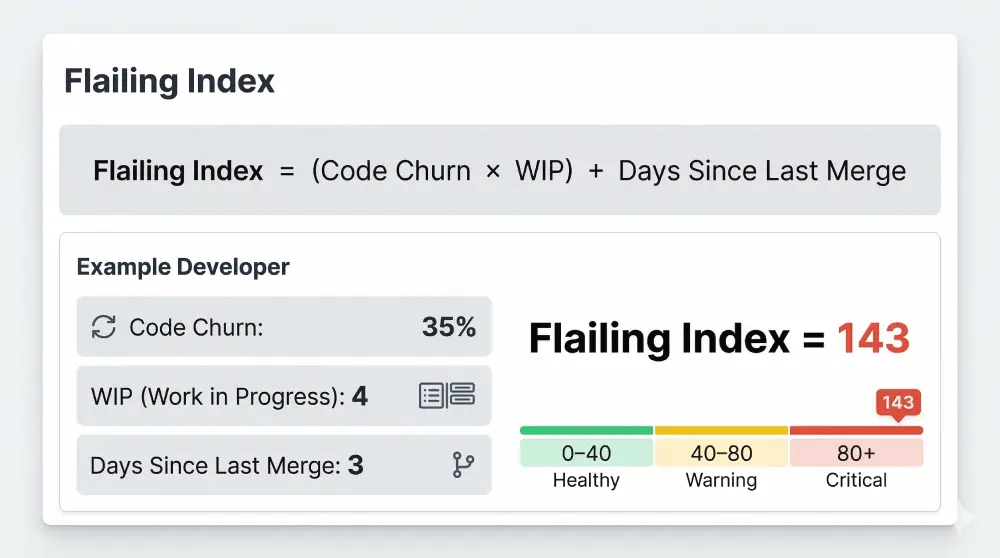
The Flailing Index: Composite Diagnostic
By combining these metrics, we create a composite “Flailing Index”:
Flailing Index = (Code Churn × WIP Count) + Days Since Last Merge
A high Flailing Index signals a team that is frantically typing but delivering nothing. It is the digital signature of a Watermelon Project in the making. It allows the manager to intervene when the team is struggling, rather than waiting for them to fail publicly.
The 48-Hour Escalation Rule: Mechanizing Help
Telemetry detects the fire. Governance prevents it. The Mum Effect thrives in cultures where reporting a problem is perceived as a failure. We must invert this dynamic.
We must install a “Culture of Escalation” where hiding a blocker becomes a compliance violation. Reporting one is rewarded. This requires a fundamental shift from “Hero Culture” (where individuals solve impossible problems alone) to “System Culture” (where the team solves problems together).
The Core Policy
The Rule: Any blocker that cannot be resolved within 48 hours must be flagged to the Engineering Manager or Director level.
This rule mechanizes the “ask for help” moment. In typical environments, a Senior Engineer might spend five days struggling with an obscure bug. Their ego prevents them from admitting defeat. They believe they are “just one hour away” from the solution. The 48-Hour Rule removes the ego variable. They are required to escalate by compliance protocol, not personal judgment.
The timeline works as follows:
- Day 1: Attempt to solve independently.
- Day 2: Attempt to solve independently.
- Hour 48: Flag raised. No shame, just process.
This transforms escalation from a “cry for help” (perceived weakness) to a “compliance report” (professionalism). It protects the engineer from their own optimism. It protects the project from silent decay.

Implementation in Jira:
Create an “Aged Issue” automation. If a ticket status is unchanged for 48 hours, auto-comment: “This ticket has been static for 48 hours. Please update status or escalate to Blocked.”
If tagged “Blocked” for more than 24 hours, auto-alert the Delivery Manager via Slack. This ensures that blockers do not become background noise that everyone learns to ignore.
Automated Risk Triggers for Pull Request Decay
Pull Requests are where velocity goes to die. A PR sitting unreviewed represents “Waiting Waste.” It blocks the developer from finishing the task. It prevents the code from generating value.
The Trigger: Any PR open without review interaction for more than 24 hours.
The Action: A Slack alert is sent to the pod channel. If it reaches 48 hours, it escalates to the engineering leads channel.
An aging PR signals deeper issues than simple laziness:
- Fear: The code is so complex or messy that peers are afraid to review it. They open it, scroll through 50 files, and close it again.
- Gridlock: Everyone is too busy with their own WIP to review others (see WIP Saturation).
- Disengagement: The team lacks collective ownership. They view “Review” as secondary to “Coding.” In reality, review is the gateway to value realization.
The Standard: Enforce a “Review First” policy. Before a developer picks up a new ticket, they must check the PR queue. If there is a PR waiting, they must review it. This ensures that the flow of value (deploying code) always takes precedence over the creation of inventory (writing new code).
The Glass Box Principle
Traditional outsourcing operates on a “Black Box” model: Client sends requirements, vendor works in silence for two weeks, vendor delivers (or delays). The Glass Box inverts this completely.
In a Glass Box model, the client has read-access to the vendor’s Jira board, Git repository, and CI/CD logs. Transparency becomes a compliance requirement, not a courtesy.
The implementation includes three components:
- Jira Integration: Work happens on your board, not a separate vendor board. You see the comments, the blockers, and the churn in real time.
- Slack Integration: All technical discussions happen in shared channels. You see the debate, the confusion, and the resolution as it unfolds.
- Stand-up Visibility: The daily stand-up is not a status report for the boss. It is a synchronization event. Clients are invited (but not required) to attend.
This visibility eliminates green-shifting because the client can see the “red” signals (churn, stale tickets) in real time. They see them just as the engineers do. It removes the vendor’s ability to hide bad news until it becomes a crisis.
Managing Flow, Not People: The Anti-Micromanagement Framework
The “Reluctant” Engineering Manager often equates “governance” with “watching people type.” This is a fundamental misconception. Effective governance is not about managing people. It is about managing work.
By shifting focus from “Resource Efficiency” (is everyone busy?) to “Flow Efficiency” (is work moving?), we eliminate the need for micromanagement entirely.
Value Stream Mapping: Visualizing the Wait States
Value Stream Mapping (VSM) is a Lean management technique adapted from manufacturing (Toyota Production System) to software. It visualizes the entire journey of a feature from “Concept” to “Cash” (deployment).

The core metric is Flow Efficiency:
Flow Efficiency = (Active Work Time / Total Lead Time) × 100
In most engineering teams, Flow Efficiency is shockingly low. It often sits around 15 percent.
- Active Time: Coding, testing (value-adding activities).
- Wait Time: Waiting for specs, waiting for code review, waiting for QA environment, waiting for deployment (non-value-adding waste).
Watermelon Projects rot in the “Wait States.” A ticket might be “green” because the developer finished coding it. But if it sits in a “Ready for QA” column for five days because the QA environment is unstable, the project is actually “red.”
Traditional status reports miss this. The developer reports “Done” (coding is done). VSM exposes this latency. It forces the manager to examine the spaces between the columns on the Kanban board, not just the columns themselves.
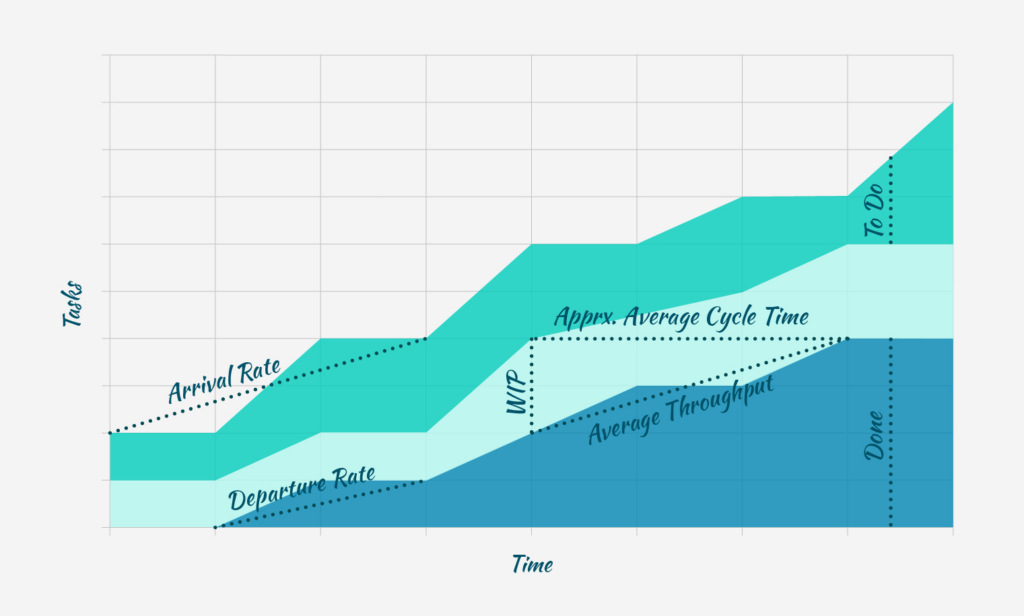
Visual Strategy: The Cumulative Flow Diagram
Instead of a simple to-do list, use Cumulative Flow Diagrams to visualize “queues.” A widening band of “Ready for Review” in the diagram instantly visualizes a bottleneck. This prompts the manager to intervene. They don’t pressure developers. Instead, they assign more reviewers or pause new work to clear the queue.
Escaping the Story Point Inflation Trap
One of the primary drivers of green-shifting is the gaming of Story Points.
The phenomenon works as follows:
- A team is pressured to increase velocity.
- They cannot code faster, so they subconsciously inflate estimates.
- A “3-point” story becomes a “5-point” story.
- The result: “Velocity” graphs trend upward (green), but actual feature delivery stays flat (red).
The Fix: Replace Story Points with Cycle Time.
Stop measuring “Points Completed.” Start measuring “Cycle Time” (Start to Finish, measured in hours). Time cannot be inflated.
If a team delivers 50 points but Cycle Time increases from three days to five days, the team is slowing down, not speeding up. Cycle Time is an empirical reality. Story Points are a negotiated fiction.
Resource Efficiency Versus Flow Efficiency
Micromanagers ask: “Why is Developer X idle?”
Flow Managers ask: “Why is Ticket Y stuck?”
When we optimize for Resource Efficiency (keeping everyone 100 percent busy), we maximize WIP. As Weinberg’s data demonstrates, this maximizes context switching and minimizes output.
When we optimize for Flow Efficiency, we accept that developers might sometimes be idle (slack). This ensures that when work does arrive, they can swarm it immediately.
The Swarm Protocol: If a ticket is blocked or a build fails, the team “swarms.” Multiple developers drop their individual tasks to clear the blocker. This lowers individual “utilization” but dramatically increases “ticket velocity.” It ensures that critical work never sits in a wait state accumulating delay.
Behavioral Diagnostics: Reading the Silent Signals
Even with the best telemetry, human behavior provides subtle “Soft Signals” that predict a project going off-track. These are behavioral markers that often appear before the “Hard Signals.” They require a manager attuned to the nuances of communication and team dynamics.
Knowledge Transfer Latency
In outsourced or distributed teams, the “understanding gap” represents a major risk. The traditional approach asks: “Do you understand?” This provides zero signal. The Mum Effect and cultural politeness dictate that the answer will always be “Yes.”
The Metric: Time to First Independent Merge.
How long does it take for a new pod to merge a non-trivial PR without significant hand-holding?
The target: Less than two weeks.
If at Week 3 the internal lead is still rewriting the pod’s code, the knowledge transfer has failed. The project is red. This indicates that the external team is acting as “hands” but not “brains.”
The “Teach-Back” Protocol: Require engineers to “teach back” the requirement to the lead. “Explain to me how this API endpoint handles a 404 error.” If they cannot explain it simply, they do not understand it. This shifts the burden of proof from asking to explaining.
The Hedging Update
Language analysis of status updates can reveal hidden risks.
Signal 1: The “Basically Done” Trap
“It’s basically done, just wrapping up a few edge cases.”
Translation: “I have hit a wall and I am hoping a miracle happens.”
Action: Treat “Basically Done” as “Not Started.” Demand a demo of what works now. If it cannot be demoed, it is not done.
Signal 2: The Silent Retreat
Watch for these warning signs:
- Reduced participation in public Slack channels
- Moving conversations to direct messages
- Cameras off during stand-ups
These are signs of withdrawal due to anxiety over a failing task. The developer is hiding to avoid questions.
The Hero Complex
Beware the “Hero Developer” who works weekends to save the sprint.
The Signal: Commits at 2 AM or on Sundays.
The Risk: Heroes mask systemic failure. If the project requires heroism to stay green, it is actually red. Heroes burn out. Systems do not. A process that relies on a specific individual working overtime is a fragile process destined to collapse.
Governance Action: Flag off-hours commits as a risk, not a virtue. Investigate why the workload required it. If it happens twice, the sprint planning process is broken and needs immediate remediation.
The Governance Checklist: Daily, Weekly, Monthly Protocols
Daily Routine (The Delivery Manager Protocol)
☐ Check “Stale Tickets” (more than 48 hours in current status)
☐ Check “PR Aging” (more than 24 hours without review)
☐ Check “WIP Limits” (any developer with more than 2 active tickets?)
☐ Review “Blockers” (are they clearly tagged with an owner?)
Weekly Routine (The Telemetry Review)
☐ Review Code Churn trends (is anyone spiking above 30 percent?)
☐ Review Cycle Time (is it trending up or down?)
☐ Review Flow Efficiency (where are the wait states occurring?)
☐ Review “Escalations” (did we follow the 48-hour rule?)
Monthly Routine (The Strategic Audit)
☐ Watermelon Check: Compare “Reported Status” versus “Telemetry Reality”
☐ Recovery Window Analysis: Did we catch risks early enough to resolve them at linear cost?
☐ Knowledge Transfer Audit: Can the external team teach the internal team, or are they still dependent?
From Trust to Telemetry: The Path Forward
The Watermelon Project thrives in darkness. It feeds on ambiguity, politeness, and subjective optimism. To kill it, we must flood the project with light.
We replace:
- “I think we are on track” with “Cycle Time is 3.4 days”
- “I’ll try to fix it” with “Escalation Triggered at 48 hours”
- “Trust me” with “Here is the dashboard”
For the Engineering Manager, this represents the shift from being a “status chaser” to a “systems architect.” For the CEO and CFO, it provides assurance that capital is being converted into code, not just status reports.
The action plan is straightforward:
- Install the Telemetry: Connect your repositories to a DORA metrics dashboard (LinearB, Jellyfish, or open-source equivalents).
- Set the Baselines: Churn less than 30 percent, WIP less than 2, Commit-to-Deploy less than 48 hours.
- Enforce the 48-Hour Rule: Make it a compliance standard, not a suggestion.
- Partner with Competence: Choose partners who operate these protocols natively. Ensure that you never again wake up to a red dashboard on the day of launch.
By following this operational governance playbook, we do not just manage projects. We mechanize success. We remove the variables of luck and hope. We replace them with the constants of data and discipline. This is how engineering organizations scale without chaos. This is how you kill the Watermelon Project for good.