🎧 Listen to the Podcast Version
Prefer listening over reading? This is a podcast-style discussion generated from the article — not a text-to-speech narration.
⏱ ~ 24 min listen • Best for multitasking
TL;DR
- Change Failure Rate (CFR) is more than a stability signal. Teams with high CFR pay 2 to 4 times more per code change than elite teams due to technical debt drag.
- Shadow rework makes CFR look healthy while burning 20 to 42% of engineering capacity invisibly, especially in AI-augmented workflows.
- Lead time is a financial metric. Every extra day a feature sits unreleased destroys revenue, compresses competitive windows, and erodes conversion rates.
- Elite MTTR (under 1 hour) is not about heroic engineers. It is about architectural patterns: feature flags, automated rollbacks, and real observability.
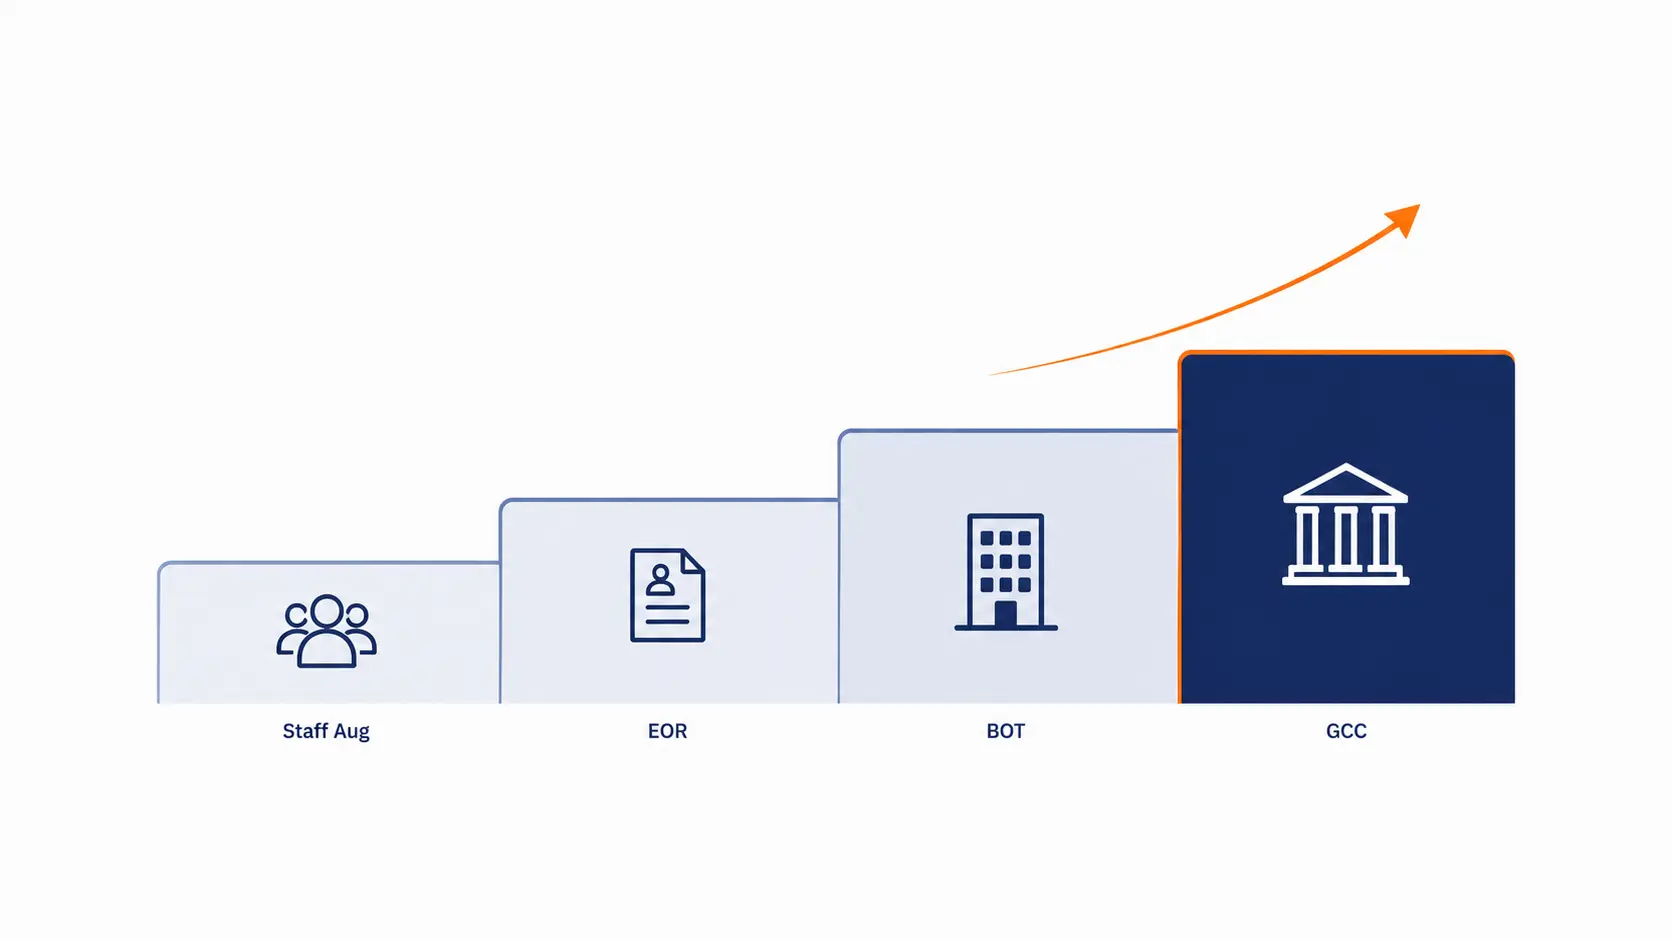
- Global delivery models can hurt DORA if badly structured. Dedicated pods with clear ownership outperform follow-the-sun chains on all four metrics.
- Tenure is a DORA lever. High churn resets institutional memory and quietly extends MTTR on every future incident.
- A 1-point CFR increase can cost enterprises tens of millions of dollars annually when downtime, rework, and opportunity cost are properly calculated.
Why DORA Is Being Used Wrong
Most engineering teams track DORA as a reporting exercise. They publish four numbers per quarter and move on.
That is the wrong use.
DORA metrics are diagnostic instruments. They expose where your architecture is brittle, where your pipeline is bleeding money, and which processes are silently eating engineering capacity. When used correctly, they give CTOs and CFOs a shared financial language around software delivery risk.
The problem is aggregation. Org-wide averages hide what matters. A “High” performer average can mask two elite teams and three teams in crisis. A nominally acceptable CFR can conceal thousands of hours of shadow rework that never gets counted as a failure.
This post covers the advanced, financial-diagnostic layer of DORA: shadow rework, cost of delay, global delivery trade-offs, single points of failure, and how to turn CFR into a number a CFO will act on.
The CFR Illusion and the Shadow Rework Problem
Change Failure Rate measures the percentage of deployments that require emergency remediation. Elite teams keep it under 15%. Many average teams sit closer to 50%. That gap is not just a stability difference. It is a cost multiplier.
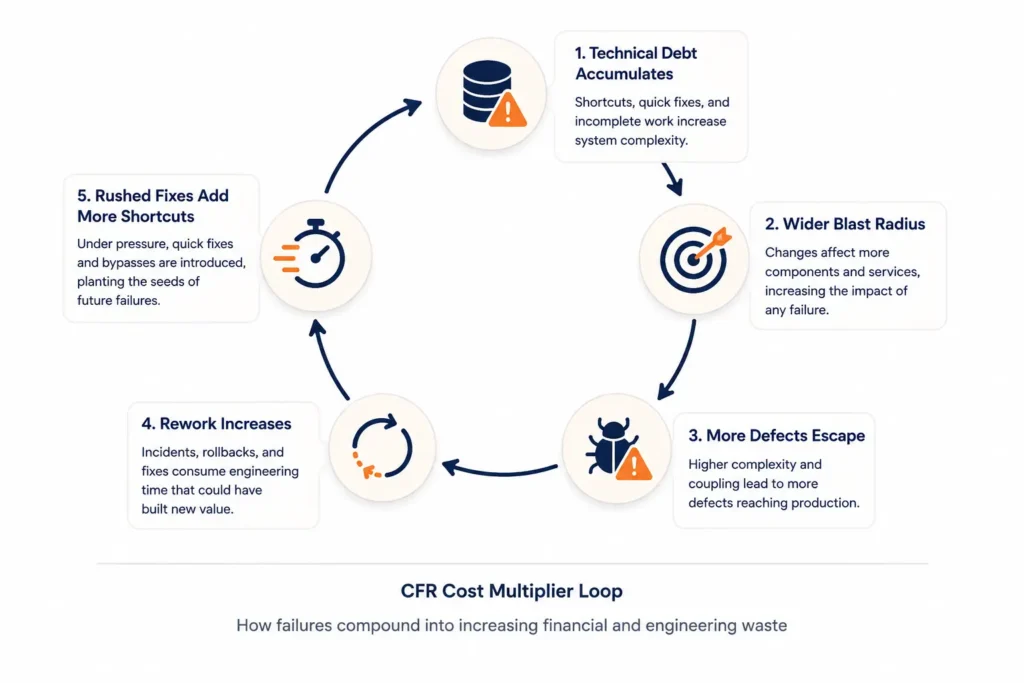
Research Finding: Teams with high CFR carry 2 to 4 times higher technical debt drag per change than elite teams. Every deployment is more expensive and riskier because the blast radius is wider.
The mechanism is self-reinforcing:
- High debt makes changes touch more services and code paths.
- Wider blast radius increases defect probability.
- Every defect generates rework.
- Rushed hotfixes introduce new shortcuts back into the system.
What Shadow Rework Actually Looks Like
Modern AI-augmented workflows make this worse. AI tools dramatically increase individual coding speed. But they also tempt teams into merging larger, more complex pull requests. The result is a 7.2% reduction in delivery stability when small-batch principles are abandoned.
The failure pattern in many teams looks like this:
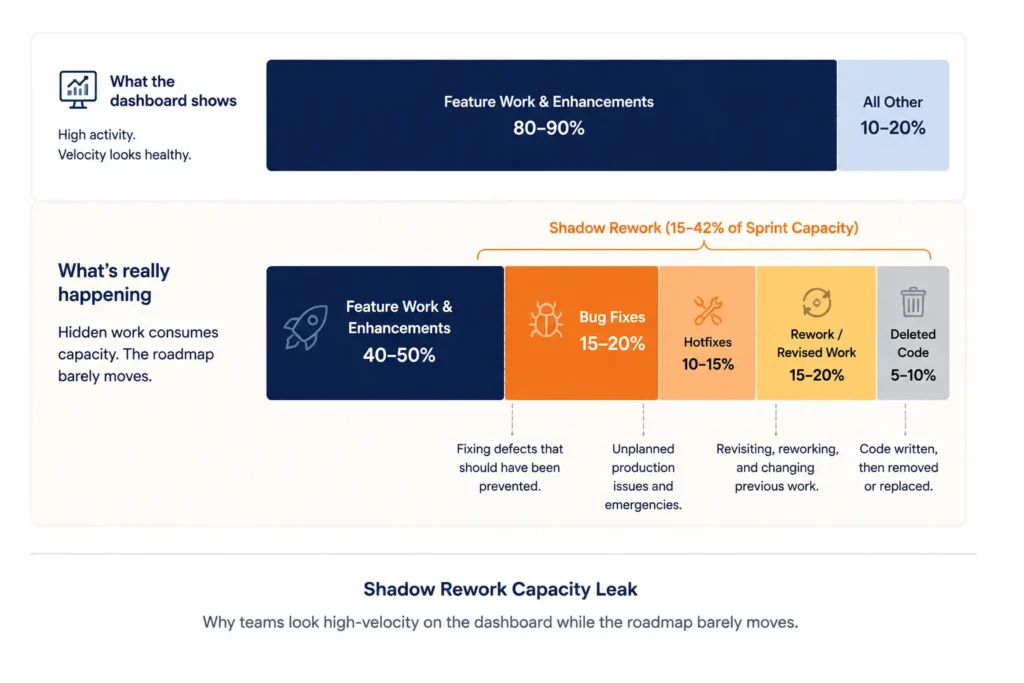
- High deployment frequency (looks great on the dashboard)
- Nominally acceptable CFR (failures caught pre-production)
- High rework rate and a large share of sprint capacity spent on bug fixes
This is what practitioners call the “CTO scar” pattern. The team appears high-velocity. The roadmap barely moves. The difference lives in invisible rework: code fixed or deleted shortly after introduction, hotfixes that never get counted as failures, and bug-fix tickets consuming 15 to 42% of sprint capacity.
Pro Tip: Pair CFR with two companion metrics: rework rate (percentage of code changed or deleted within days of merging) and bug-fix share of sprint. If deployment frequency is high but rework rate is also high, you are buying throughput by silently capitalizing quality problems as debt.
The MTTR Gap Between High and Elite Teams
The difference between “High” and “Elite” recovery times is not talent. It is architecture.
| Performance Tier | MTTR Target |
| Elite | Under 1 hour |
| High | Under 24 hours |
| Medium | 1 day to 1 week |
| Low | More than 1 week (sometimes months) |
Sources :atlassian.com,newrelic.com
What separates elite teams from high performers comes down to four specific practices.
- Small batch sizes with automated rollbacks. Elite teams deploy narrow, well-tested changes. When something breaks, the rollback scope is small and the pipeline does it automatically. Manual recovery processes make sub-1-hour MTTR mathematically impossible.
- Feature flags as kill switches. Deploying behind a feature flag decouples the deploy event from the release event. A bad feature can be disabled in milliseconds without redeploying anything. Christian Dior reduced time-to-market updates from 15 minutes to instantaneous using this pattern.
- Fine-grained observability with AI-assisted triage. In traditional setups, diagnosing a failure means manual log correlation and detective work. Elite teams connect “what changed” to “what broke” in real time. AI-powered diagnostic runbooks cut the investigation phase that normally consumes most of the MTTR window.
- Runbooks and practiced incident response. Maintained runbooks and regular game days reduce decision paralysis during incidents. The goal is to remove coordination overhead, not to test whether people work hard under pressure.
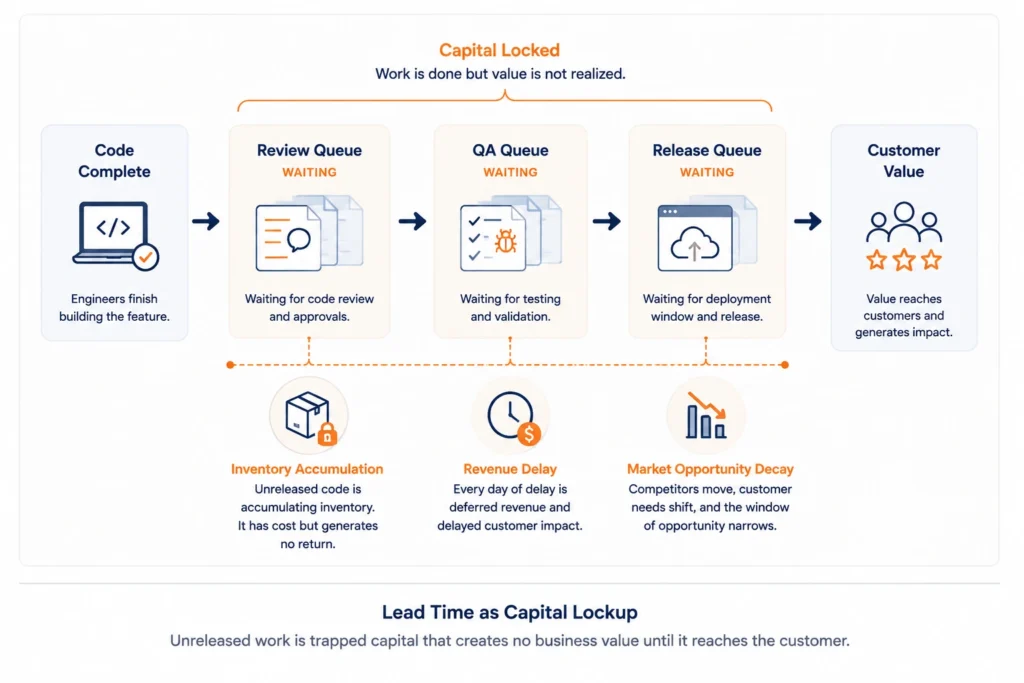
Lead Time as a Financial Metric
Engineering teams understand lead time as an operational measure. CEOs and CFOs should understand it as a revenue and capital efficiency metric.
Code sitting in a repository waiting to ship is depreciating inventory. It ties up working capital. It generates no return until it reaches a customer. And in competitive SaaS markets, the decay starts immediately.
The Opportunity Cost Model
The CD3 framework (Cost of Delay Divided by Duration) quantifies the financial loss of each day a feature is not live. Cost of Delay (CoD) combines three components:
| Component | What It Measures |
| User and Business Value | Direct monthly revenue, ARR protected from churn, operational costs saved |
| Time Criticality | Value decay rate. Hard deadlines and seasonal windows have exponential multipliers |
| Risk and Opportunity Enablement | Cost of deferred security patches, strategic capacity blocked by operational work |
A concrete example: 25 delayed enterprise deals, each worth $50,000, held for 17 excess days at a 30% annual opportunity cost equals approximately $170,000 in delayed revenue for that batch alone. A feature projected to generate £3 million over five years loses £50,000 for every month it does not ship.
A general model for comparing a 10-day lead time to a 2-day lead time: the opportunity cost of the extra 8 days equals approximately 8/30 of that feature’s first-month revenue, before accounting for second-order effects like reduced churn or shorter sales cycles.
The Context Switching Tax
Long lead times create a second financial drain that does not show up in CFR or MTTR: forced context switching.
When code sits idle in review queues or staging bottlenecks, developers pick up new tickets to stay utilized. This generates a tax on every engineer in the pipeline.
The data is specific:
- It takes an average of 23 minutes and 15 seconds to regain full cognitive focus after a significant interruption.
- Knowledge workers switch tasks every 3 minutes on average in high-interruption environments.
- A 10-person engineering team experiencing routine context switching loses approximately 11.25 hours per developer per week to reorientation overhead alone.
- At a blended rate of €110 per hour, this equals roughly €7,400 per month in lost productivity per team. That is the cost of shipping an extra feature per sprint, burned on nothing.
Interrupted tasks contain roughly twice as many errors and take twice as long as uninterrupted ones. The bugs introduced by context switching then feed directly back into CFR and rework rates. The loop is tight and expensive.
The DORA Diagnostic Cheat Sheet
Use this table as a triage reference. Map the symptom you are seeing to the most likely root cause category before deciding where to invest.
| DORA Signal | Surface Symptom | Most Likely Root Cause | First Place to Look |
| High deployment frequency, rising CFR, MTTR over 24 hours | “We ship a lot but something breaks badly every week.” | Architecture and test strategy. Brittle monolith or tangled microservices. | Batch size, service coupling, critical path test coverage, rollback mechanics. |
| High frequency, acceptable CFR, but large sprint fraction on bug fixes | “Velocity looks good but the roadmap barely moves.” | Shadow rework from technical debt and AI-generated code. | Rework rate, bug-fix share of sprint, hotfix-only deploy patterns. |
| Low deployment frequency, long lead time, decent CFR and MTTR | “Releases are rare but safe. Everything feels slow.” | Process and governance bottlenecks. Queues, approvals, environment contention. | Code review queue depth, staging environment wait times, approval step latency. |
| Lead time increasing, CFR flat, MTTR flat | “Work takes longer. Incidents not obviously worse.” | WIP overload and context switching. Too much work in flight. | WIP per developer, ticket age distribution, open branch count per engineer. |
| Good aggregate DORA but incidents always need the same senior engineer | “We are statistically fine but the same person gets paged at 2AM.” | Bus factor of one. Knowledge concentration risk. | On-call rotation data, incident ownership logs, service change review patterns. |
| CFR high in one or two services only | “Most systems are fine. These two are always on fire.” | Localized technical debt and architectural hotspots. | Defect density by service, change volume history, test coverage and observability gaps. |
| MTTR longer when incidents originate in off-hours time zones | “If it breaks in our other region, recovery drags.” | Follow-the-sun handoff quality. Fragmented ownership. | Handoff documentation quality, on-call coverage mapping, pod ownership clarity. |
| Lead time and MTTR both better in long-tenure pods | “The senior team ships and fixes faster than the newer team.” | Tenure and onboarding effectiveness. Institutional memory gap. | Average tenure, time-to-productivity for new hires, cross-training coverage. |
| DORA metrics stagnant despite major tooling investment | “We bought the platform. Performance did not move.” | Misaligned incentives. No continuous improvement loop. | Whether metrics are used for learning vs. individual ranking. Retrospective frequency and quality. |
The Financial Formula for CFR
To take CFR to a CFO, you need a number. Here is the model.
Variables:
- D = total deployments per period
- f = Change Failure Rate (decimal, e.g. 0.05 for 5%)
- T = Mean Time to Recovery (hours per failure)
- R = revenue at risk per hour of downtime
- E = blended engineering and ops cost per hour during incidents
- W = additional engineering hours per failure for root cause analysis, postmortems, and rework
Total period cost of change failures:
Total Cost = D x f x (T x (R + E) + W x E)
Marginal cost of a 1-percentage-point increase in CFR (delta_f = 0.01):
Delta Cost = D x 0.01 x (T x (R + E) + W x E)
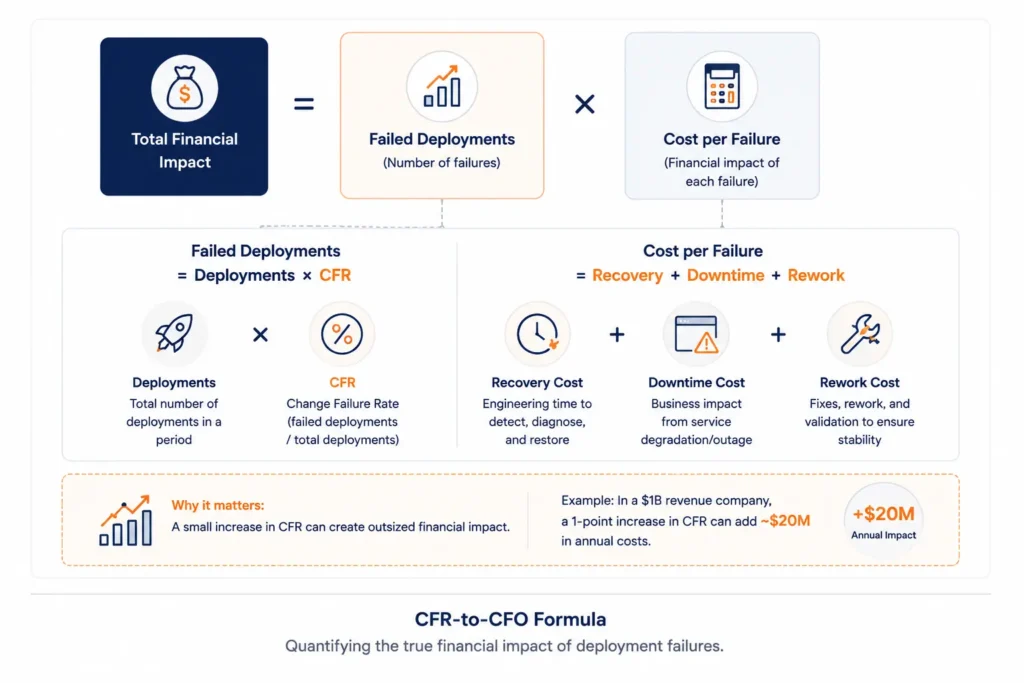
Worked example. An enterprise runs 1,000 deployments per year. MTTR is 2 hours. Combined downtime, rework, and opportunity cost is conservatively estimated at $1,000,000 per hour of failure. A 1-point CFR increase adds 10 failed deployments per year. Each failure costs $2,000,000. The annual marginal cost of that single percentage point is $20,000,000.
Research Finding: Industry data puts the median annual cost of IT outages at $76 million, with an average per-minute cost of $14,056. Sixty-two percent of outages are caused directly by change failures. In financial services, high-impact outages average $1.8 million per hour.
This formula reframes CFR from a DevOps KPI to a risk reserve calculation. A 3-point CFR improvement is not an engineering win. It is a quantified liability reduction.
Global Delivery Through a DORA Lens
Distributed teams introduce architectural decisions that directly affect all four metrics.
Follow-the-Sun vs. Dedicated Pods
| Dimension | Follow-the-Sun | Dedicated Pod |
| Lead Time | Can reduce calendar time by up to two-thirds with three sites | Short lead time through localized ownership and no cross-timezone queues |
| CFR | Pressure increases without perfect documentation and shared standards | Typically lower due to cohesive context, integrated QA, and clear service ownership |
| MTTR | Slow if handoff context is poor or ownership is fragmented | Fast because the pod holds full system knowledge and on-call coverage |
| Deployment Frequency | Can increase if pipelines are independent | Higher frequency due to reduced approval overhead |
| Operational Cost | High coordination overhead | Lower coordination cost, higher unit team investment |
Follow-the-sun can work inside a pod model: a Kathmandu pod and a European or US counterpart sharing true end-to-end ownership of a service. What does not work is a chain of loosely coupled sites with fragmented accountability and sequential handoffs.
Pod-based delivery models consistently report 40% faster feature delivery than traditional outsourcing when ownership and pipeline autonomy are preserved.
Retention as a DORA Lever
Roughly 69% of software developers have tenure under two years. Replacing one engineer costs 30 to 70% of annual salary and typically delays active sprints by two or more weeks. Without structured onboarding, new engineers take up to six months to reach full productivity. Strong onboarding compresses that window to under 90 days.
The DORA connection is direct:
- High churn repeatedly resets codebase familiarity. Unfamiliar engineers make changes in areas they do not fully understand. CFR rises.
- During incidents, new engineers spend most of the MTTR window learning the system before they can attempt a fix. MTTR extends.
- Teams with multi-year average tenure hold deep mental models of critical systems. They bypass investigation phases and move directly to remediation.
Pro Tip: Treat cross-training, mandatory multi-reviewer code review, and bus factor audits as DORA investments, not HR hygiene. Allocate 20 to 25% of sprint capacity explicitly to resilience activities: cross-training, documentation, and joint incident reviews. Track whether CFR and MTTR improve in the specific services that receive this investment.
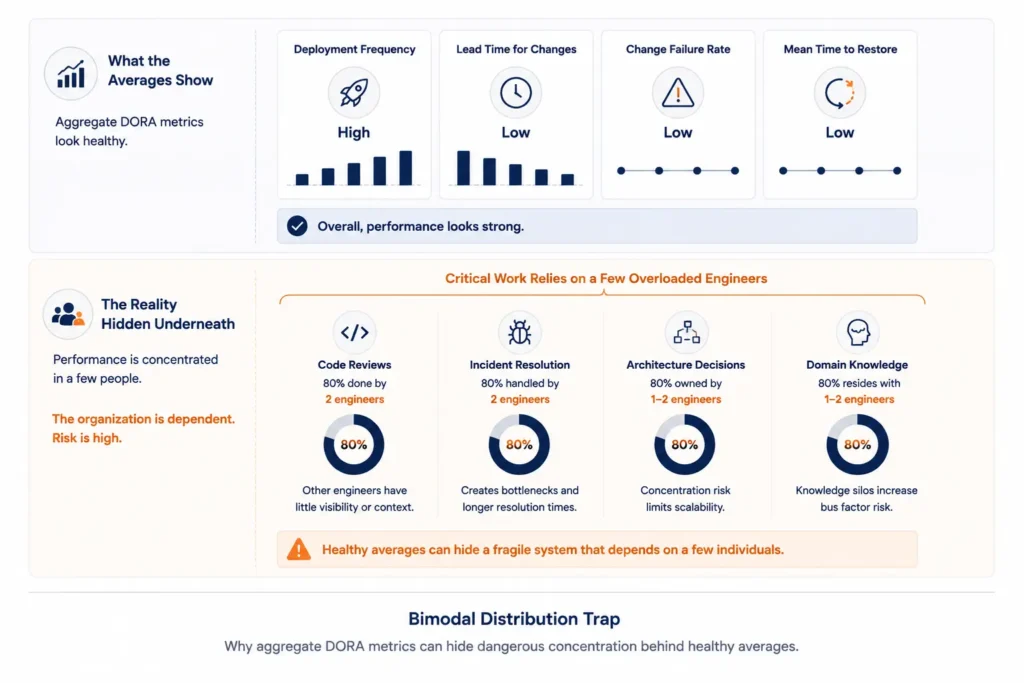
The Bimodal Trap and Single Points of Failure
Org-level DORA averages frequently hide a Pareto distribution. In many engineering organizations, 20% of engineers account for 80% or more of successful deployments and incident resolutions. The other 80% are constrained by broken pipelines, knowledge gaps, or systemic friction.
The aggregate metric looks “High.” The histogram is bimodal: two distinct populations performing very differently.
To surface this, segment DORA by service, repository, and pod rather than by department. Then overlay two additional data sources:
- Code ownership and on-call logs. If one or two engineers appear on a disproportionate share of successful deployments and incident resolutions, you have found a knowledge concentration risk.
- Cycle time breakdown by review state. If pull requests consistently stall until a specific person is available, that person is a single point of failure. Lead time variability is often entirely a function of one individual’s availability.
Mitigation is not about redundancy for its own sake. It is about ensuring that operations continue seamlessly regardless of individual availability. Rotating service ownership, mandatory pair reviews on critical paths, and explicit bus factor targets turn this from a people problem into an architecture decision.
DORA as EU AI Act Article 17 Evidence
Article 17 of the EU AI Act requires providers of high-risk AI systems to maintain a documented Quality Management System (QMS). The QMS must cover design controls, development, testing, risk management, data governance, post-market monitoring, and incident reporting. It must be auditable, evidence-based, and tied to ongoing improvement.
DORA metrics map directly into several Article 17 obligations:
| Article 17 Requirement | Relevant DORA Metric | What It Demonstrates |
| Design controls and quality assurance (Art. 17(1)(c),(d)) | CFR and lead time trends | Quantitative evidence of test suite effectiveness and code review quality over time |
| Risk management and incident handling (Art. 9, 17(1)(g), 72, 73) | MTTR and failed deployment frequency | Whether risk controls are reducing failure severity and duration in production AI systems |
| Post-market monitoring and continual improvement (Art. 17(1)(h)) | Longitudinal DORA trends | Whether process changes (e.g., adding human-in-the-loop gates) are improving AI system stability |
For organizations already subject to EU DORA (the financial sector regulation on ICT risk), tracking DevOps DORA metrics simultaneously satisfies cybersecurity incident reporting timelines under NIS2 (24 to 72 hours) and AI Act quality assurance mandates. One audit trail. Two regulatory obligations.
Running the Zero-Micromanagement Operating Model
The goal of instrumenting DORA properly is to make management questions systemic rather than personal.
The shift is simple: stop asking “What are you working on?” and start asking “What is blocking the flow of value through the pipeline?”
Here is the operating pattern.
Step 1: Standardize metric definitions across all pods. What counts as a deployment? What qualifies as a failure? What marks the start and end of recovery? Without consistent definitions, DORA numbers are not comparable and cannot be audited.
Step 2: Add the companion metrics that expose hidden waste.
- Rework rate (code changed or deleted within days of merging)
- Bug-fix share of sprint capacity
- WIP per developer
- Incident count per service per period
Step 3: Segment by pod, service, and region. Prevent global averages from hiding bimodal performance. If a Kathmandu pod has dramatically better MTTR than a newer team, that is information. Use it.
Step 4: Replace status meetings with Flow Reviews. Run a weekly or biweekly review with CTO, product, and engineering leads. The only questions on the agenda:
- Where is lead time increasing, and why?
- Where is CFR or MTTR above threshold, and what did we learn from recent incidents?
- Which pods or services are outliers, and what practices do we spread or fix?
Step 5: Use DORA to drive experiments, not rankings. Tie metric changes to specific process or architecture interventions. Run time-boxed experiments. Measure before and after. Celebrate teams that reduce CFR and MTTR while maintaining deployment frequency.
Step 6: Connect DORA to CFO and compliance narratives. Express lead time improvements in quarterly revenue impact using the cost-of-delay model. Map CFR cost scenarios for the board. Plug incident review data directly into your AI Act QMS documentation.
Once CEOs and CFOs see that a 1-point CFR increase costs a specific dollar amount per quarter, and that elite MTTR is a risk-control asset for AI compliance, the conversation changes. The only question left is: “Where is our flow constrained, and what systemic change removes that constraint?”
That is the right question. Everything else follows from it.
Stop Managing. Start Shipping.
Stop fixing “outsourced” spaghetti code.
Deploy an ISO 27001-certified engineering pod that hits your internal linting standards and security benchmarks from Day 1.