Prefer listening over reading? This is a podcast-style discussion generated from the article — not a text-to-speech narration.
⏱ ~
24 min listen • Best for multitasking
TL;DR
Story points and logged hours measure activity. They do not measure output.
Four metrics (Cycle Time, PR Idle Time, Flow Efficiency, DORA) expose delivery risk that hours never will.
PR idle time alone costs an average engineering team $23,780 per developer per year.
Vendors game metrics when those metrics become targets. The fix is structural, not contractual.
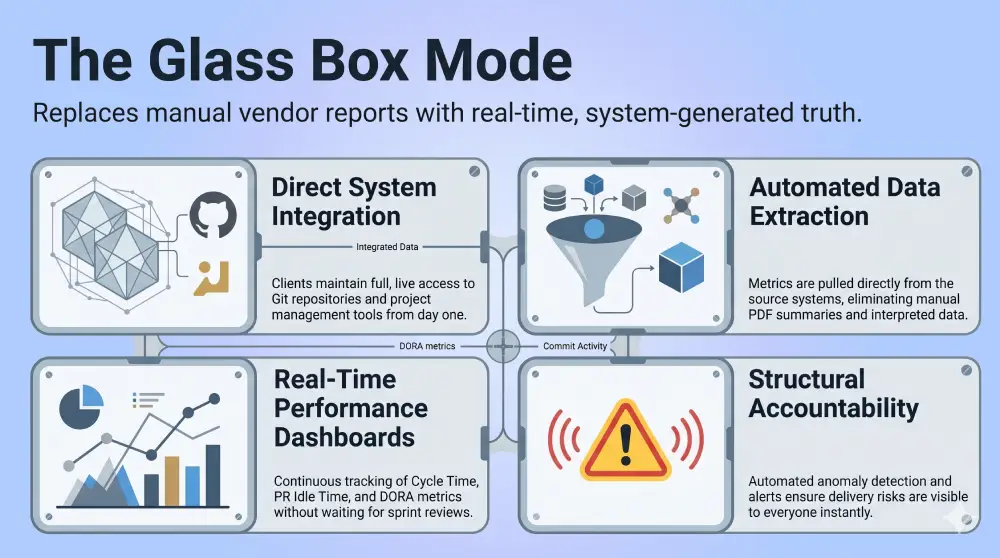
A Glass Box engagement model (live repo access, live boards, automated data extraction) removes the information gap that makes gaming possible.
Techkraft builds every client pod on this model by default. No manual reports. No PDF summaries.
Your Vendor Billed 1,600 Hours Last Month.
Your feature shipped three weeks late.
Both of those facts can be true at the same time. And if you are still tracking vendor performance through hours logged and story points closed, you will never understand why.
This is the core problem with how most CTOs manage outsourced engineering today. The metrics they demand are easy to produce, easy to inflate, and nearly useless for predicting delivery outcomes. Hours tell you how long people sat at their desks. Story points tell you how many tickets got moved to “Done.” Neither tells you whether value was actually built or when it will ship.
The goal of this post is simple: review and include the four metrics that actually matter alongside your existing ones, show you the financial cost of getting this wrong, and explain the model that makes gaming those metrics structurally impossible.
The Problem with Activity Metrics
Hours, story points, and commit counts share one fatal flaw. They measure motion, not progress.
A developer can log eight hours, close four tickets, and push twenty commits while moving a feature zero days closer to production. A vendor can hit every sprint velocity target for three consecutive months while quietly accumulating technical debt that will cost twice as much to fix next quarter.
Research Finding: The DevOps Research and Assessment (DORA) program, backed by Google Cloud, has studied engineering performance across thousands of teams for over a decade. Their consistent finding is that high-performing teams are not distinguished by how much they do. They are distinguished by how fast value moves from idea to production.
Activity metrics create a secondary problem. They are easy to game. Once a metric becomes a target, developers and vendors optimize for that metric, not for the outcome it was supposed to represent. This is Goodhart’s Law applied to software delivery. When you pay for hours, you get hours. When you measure velocity, velocity goes up, whether or not throughput does.
The fix is not better enforcement of the same metrics. It is a different category of metric entirely.
The Four Metrics That Actually Matter
These four measurements give you a real picture of engineering throughput. Each one is extractable from your existing Git and project management data. None of them require a developer to self-report anything.
Metric
What It Measures
Why It Matters
Cycle Time
Time from first commit to production deployment
Reveals the true speed of your delivery pipeline
PR Idle Time
Time a pull request sits open with no reviewer activity
Exposes bottlenecks in review, approval, and merge processes
Flow Efficiency
Ratio of active work time to total elapsed time
Shows how much of a feature’s journey is waiting vs. moving
DORA Metrics
Deployment frequency, lead time, change failure rate, recovery time
Industry‑standard benchmark for engineering health
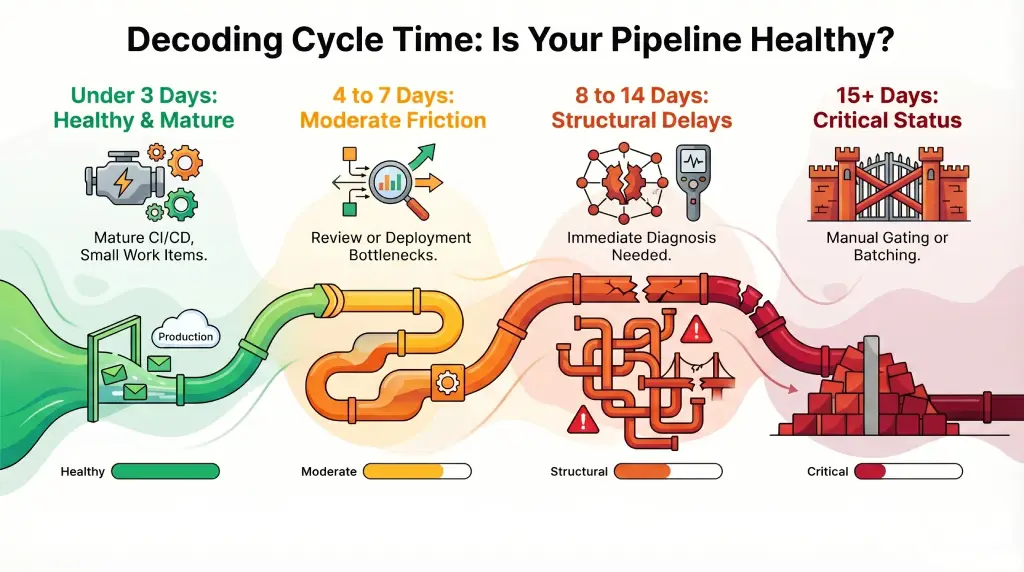
1. Cycle Time
Cycle time is the number of days from a developer’s first commit to that code running live in production. It captures every step in between: code review, staging, QA, approvals, and the production push itself.
This is the single most honest measure of how fast your team delivers. Sprint velocity tells you how many story points are closed. Cycle time tells you how long any given piece of work actually took to reach your users. Those are very different things.
A team can close 40 story points in a sprint and still have an average cycle time of 19 days. Work that “finished” in Sprint 1 is not reaching production until Sprint 2 is halfway through. The velocity number looks healthy. Your users are still waiting.
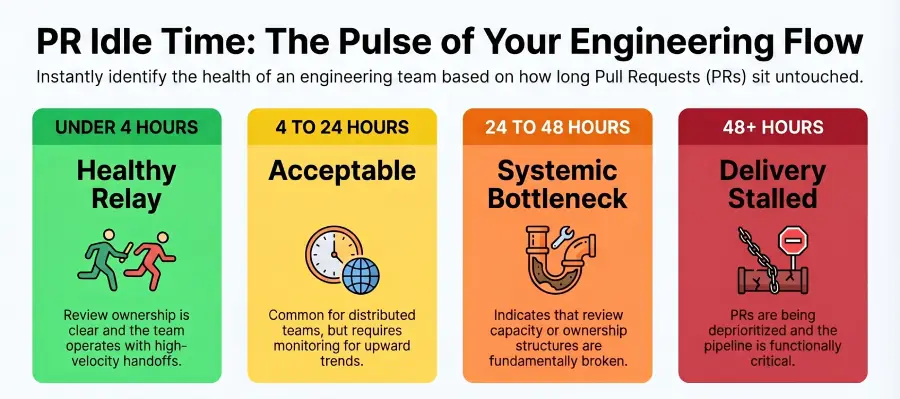
2. PR Idle Time
PR idle time measures how long a pull request sits open with zero review activity. Not how long the review takes. How long the code waits before anyone touches it at all.
This number is invisible in almost every standard vendor report. No sprint burndown captures it. No weekly status update surfaces it. But it compounds fast.
Here is what it looks like in practice. A developer finishes a feature Tuesday afternoon and opens a PR. The assigned reviewer is in a different timezone and misses the notification. By Wednesday morning, the PR has been open for 14 hours with no activity. A reviewer picks it up Wednesday afternoon and leaves comments. The developer is now deep in new work. Switching back costs time and focus. The PR merges Thursday morning. Total idle time for one ticket: over 36 hours.
Multiply that across four PRs per developer per week, across a six-person team. It compounds into a significant cost before anyone notices.
Key Insight: Research from the University of California Irvine found it takes an average of 23 minutes for a developer to return to full concentration after an interruption. Every time a developer re-engages with a stale PR, they pay that tax again.
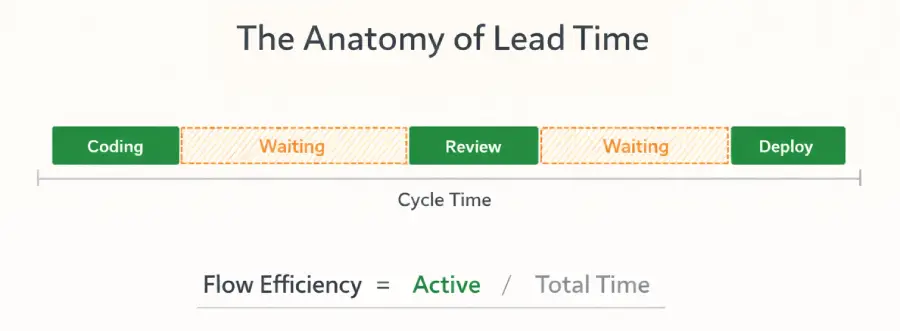
3. Flow Efficiency
Flow efficiency is the percentage of a feature’s total elapsed time that someone was actively working on it.
The formula: (Active Work Time / Total Elapsed Time) x 100
If a feature took 10 calendar days but developers were only actively working on it for 2 of those days, your flow efficiency is 20%. The other 80% of the time, the work was sitting in a queue, waiting for approval, or blocked on a dependency.
Most executives assume work progresses steadily once it starts. It does not. In most software teams, work moves in short bursts separated by long stretches of waiting.
Industry Benchmark: Research published by the Flow Framework community and cited in multiple Lean software development studies indicates that most software teams operate at 15% to 40% flow efficiency. World-class teams operate above 40%. The gap between those numbers represents pure waste baked into your delivery pipeline.
Low flow efficiency is almost never a developer performance issue. It is a systems design issue. The most common causes are work batching at handoff stages, blocked dependencies, developers juggling too many concurrent tickets, and multi-step approval chains that add calendar time even when each approval takes minutes.
Flow Efficiency
Performance Level
Below 15%
Low. Serious bottlenecks present throughout the pipeline.
15% to 25%
Industry average. Significant waste present but functional.
25% to 40%
High. Above average with addressable friction points.
Above 40%
Elite. Batches are small, handoffs are fast, queues are minimal.
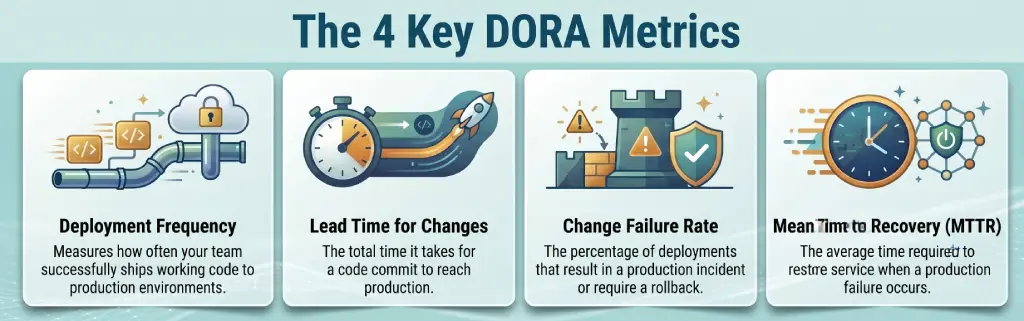
4. DORA Metrics
DORA (DevOps Research and Assessment) is a research program backed by Google Cloud that has studied tens of thousands of engineering teams since 2013. It produced four metrics that function as a universal health score for any engineering operation.
Deployment Frequency: How often does your team ship working code to production? Elite teams deploy multiple times per day. Low performers deploy once a month or less. Infrequent deployment almost always signals a fragile, high-risk release process, not a careful one.
Lead Time for Changes: How long from code commit to production? Long lead times mean your post-code pipeline (review, build, test, deploy) is creating delays through manual gates or infrequent release windows.
Change Failure Rate: What percentage of deployments cause an incident or require a rollback? Elite teams stay at 5% or below. Low performers see rates between 16% and 30%. A team deploying 20 times per week at a 20% failure rate is generating four production incidents every week.
Mean Time to Recovery (MTTR): When something breaks, how fast is service restored? Long MTTR reflects poor observability, weak incident response, and teams spending more time firefighting than building.
Research Finding: DORA’s 2023 State of DevOps Report found that Elite-performing teams are 2x more likely to meet their reliability targets and 1.5x more likely to achieve their organizational goals than Low performers. The gap compounds over time.
The Financial Cost of PR Idle Time
Most outsourced engineering conversations focus on day rates and monthly retainer costs. The hidden cost sits in idle time, and it is substantial.
Consider a team of six engineers at a fully loaded cost of $50 per hour. Now model a realistic PR review delay scenario:
Factor
Assumption
Average PRs per developer per week
4
Average PR idle time before first review
6.5 hours
Developer context‑switching cost per interruption
~23 minutes
Engineers affected per team
6
At this rate, PR idle time alone costs the team approximately $14,000 per developer per year in compounded delay and rework cost. Across a six-person team, that is $84,000 annually in waste that does not appear on any invoice.
This is not a billing problem. It is a visibility problem. You cannot fix what you cannot see.
The Glass Box Model
A Glass Box engagement is one where the client has direct, unmediated visibility into engineering operations. Not through reports. Not through dashboards the vendor controls. Through live access to the actual systems where work happens.
Here is what Glass Box visibility requires:
Direct repository access to production Git branches with full commit history and PR activity
Live project board access with unfiltered view of ticket status, blockers, and cycle time data
Automated metric extraction pulling DORA, cycle time, and flow efficiency from system data, not manual input
No manual reporting layer between the engineering team and the client
Compare this to the default Black Box model most outsourcing vendors operate:
Dimension
Black Box
Glass Box
Metric source
Vendor‑generated reports
Automated system extraction
Repository access
None or read‑only snapshots
Live, full access
PR visibility
Weekly summary
Real‑time
Cycle time tracking
Sprint velocity approximation
Exact, commit‑to‑deploy
DORA benchmarking
Self‑reported
Tool‑generated
Anomaly detection
Client‑dependent on vendor disclosure
Automated alerts
The Black Box model does not require deception to fail you. It fails you by design. Information asymmetry means your vendor always knows more about your delivery health than you do.
How Techkraft Runs This
Techkraft builds every client engagement on a Glass Box foundation. It is not a premium add-on. It is the default operating model.
Every pod ships with:
Live Git and Jira access configured at onboarding
Automated DORA metric tracking from day one
Cycle time and PR idle time dashboards available to the client in real time
No manual status reports, no PDF summaries, no interpreted data
The engineering teams operate from Kathmandu, where senior developer retention rates are meaningfully higher than in traditional outsourcing hubs. That retention matters for measurement integrity. Stable teams build institutional knowledge. They carry context across sprints. They do not reset every six months when a project team turns over.
High retention is not a cultural anecdote. It is a flow efficiency driver. Teams that stay together build faster, review faster, and accumulate the shared context that cuts cycle time over time.
The result is a model where the client’s data comes from the system, not from the vendor. The metrics are the same whether or not anyone is watching. That structural accountability is what separates a Glass Box vendor from one that manages your perception of performance.
Flow Beats Velocity. Every Time.
Activity metrics are comfortable. They are easy to collect, easy to present, and easy to hit. That comfort is exactly what makes them dangerous.
A vendor can hit 100% of your velocity targets and still be building the wrong thing slowly. A vendor operating on flow metrics cannot hide delay, cannot obscure bottlenecks, and cannot manufacture the appearance of progress.
The shift from velocity to flow is not a tool upgrade. It is a model change. It starts with demanding the four metrics above, insisting on direct access to the systems that generate them, and choosing partners who treat Glass Box transparency as a baseline, not a negotiation.
Proof is not in the pitch deck. It is in the pipeline.
Stop Managing. Start Shipping.
Stop fixing “outsourced” spaghetti code. Deploy an ISO 27001-certified engineering pod that hits your internal linting standards and security benchmarks from Day 1.
Binayak is a content and marketing specialist at Techkraft with 15+ years in IT outsourcing, project management, and agency operations. He writes about distributed teams, scalable delivery, and AI-driven systems.
Ready to Scale?
Learn how our AI experts can help you implement Agent Skills today.